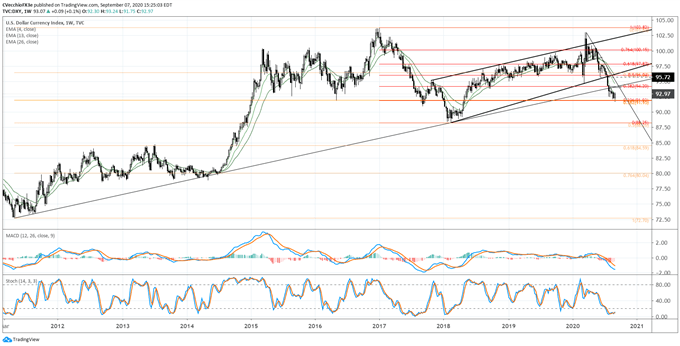
Technical Forecast for the US Dollar: Neutral
- The DXY Index is potentially showing signs of establishing a short-term bottom, having fought off a breakdown from a consolidative region during August.
- The forex economic calendar for the US Dollar is rather bare in the post-Labor Day trading period, with the notable exception of Friday’s August US consumer price index release.
- The IG Client Sentiment Index suggests that retail traders have moderated their positions in EUR/USD and USD/JPY rates.


Recommended by Christopher Vecchio, CFA
Get Your Free USD Forecast
US Dollar Attempting to Bottom?
The US Dollar (via the DXY Index) has started September on positive footing, looking to claw back some of the accumulated losses thus far through the first two months of the third quarter. While concerns remain about the ability of the United States economy to rebound swiftly, thus necessitating long-term expansionary monetary and fiscal policy to support a recovery, there have been signs that the economy has been gathering momentum once more.
And so, after the August US nonfarm payrolls report – the second-to-last US labor market report prior to the US presidential election – there is a sense that more fiscal support in context of ultra-loose monetary policy may not be arriving in the near-term. In other words, the short-term impulse driving US real yields into negative territory has subsided (for now). Such an environment may prove to be beneficial to the US Dollar as financial markets begin to shake off the summer doldrums after the US Labor Day holiday.
US Dollar Forex Economic Calendar Week Ahead
The forex economic calendar for the US Dollar is rather bare in the post-Labor Day trading period, with the notable exception of Friday’s August US consumer price index release. Although the Federal Reserve has said that they will tolerate higher inflation than the typical +2% price stability target (so as to allow for more strength in the labor market prior to normalizing interest rate policy), we’ve seen both FX and precious metals markets respond more sensitively to shifts in US interest rates, thus we cannot discount the possibility that a surprising US CPI report could result in a fair amount of volatility at the tail-end of the week.
Of course, with the Federal Reserve’s September policy meeting around the corner (the following week, September 15 to 16), we are now in the blackout window ahead of the rate decision, and thus commentary will be limited. Contextually, if the Fed is gagged, then that means more airtime for fiscal policymakers to take up the airwaves, and given what’s been said since the release of the US jobs report on Friday, the commentary may lean into markets pricing in a reduced chance of another aggressive fiscal stimulus effort prior to the November 3 US elections.
DXY PRICE INDEX TECHNICAL ANALYSIS: DAILY CHART (NOVEMBER 2016 to SEPTEMBER 2020) (CHART 1)

We’ve previously noted that “the sideways range carved out, between the 2011/2018 trendline support and the 38.2% Fibonacci retracement (of the 2017 high/2018 low range) as resistance and the August low as support, yields a range of 92.85 to 94.20. Contextually, this could be a bear flag: the favored resolution would appear to be to the downside…the measured move calls for a drop down to 91.50.”
The DXY Index was not able to fall that far, reaching a low of 91.75 last week, ultimately finding support on a weekly basis at the confluence of the 23.6% retracement of the 2017 high/2018 low range and the 38.2% retracement of the 2011 low/2017 high range at 91.93.
It still holds that “invalidation of the longer-term breakdown would occur should the DXY Index retake the rising trendline from the April 2011 and February 2018 lows. In context of the 2017 high/2018 low range, the 38.2% Fibonacci retracement would need to be cleared as well: gains through 94.00/20 would signify a potential bullish reversal” on a longer-term basis.
CFTC COT US Dollar Futures Positioning
Finally, a consideration of positioning in the futures market. According to the CFTC’s COT for the week ended September 1, speculators decreased their net-short US Dollar positions to 6.7K contracts, down from the 7.8K net-short contracts held in the week prior. Net-short US Dollar positioning is still hovering near its most extreme levels since mid-2018.


Recommended by Christopher Vecchio, CFA
Traits of Successful Traders
— Written by Christopher Vecchio, CFA, Senior Currency Strategist


Leave A Comment?
You must be logged in to post a comment.